Matplotlib ストリームプロット#
※記事内に商品プロモーションを含むことがあります。
公開日
Matplotlibでベクトル場を連続した線としてプロットするax.streamplotについて解説します。
なお、個々の位置におけるベクトルでプロットするには、ax.quiverを使用します。
ストリームプロットの例#
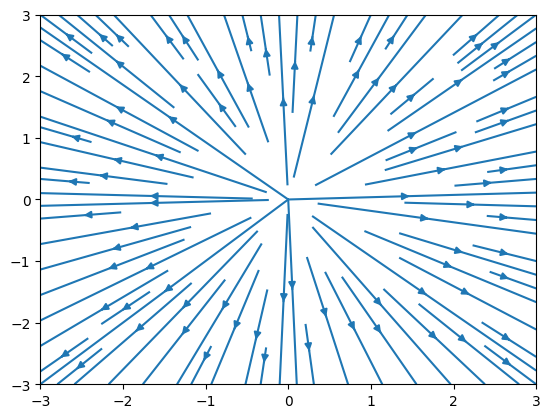
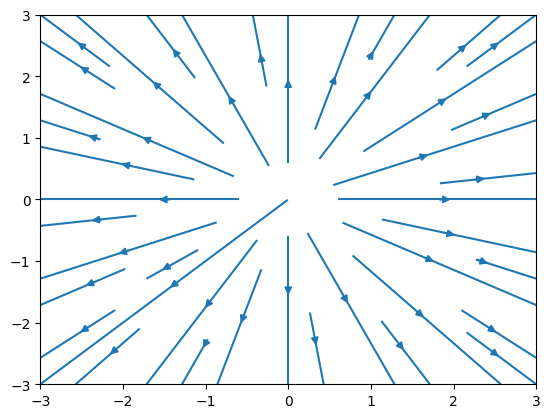
ax.streamplotを用いたベクトル場の例を以下に示します。
中心(x, y)=(0, 0)から外側に向かうベクトル場です。
import matplotlib.pyplot as plt
import numpy as np

x, y = np.meshgrid(np.linspace(-3, 3, 7), np.linspace(-3, 3, 7))
u, v = x, y

fig, ax = plt.subplots()
ax.streamplot(x, y, u, v)
plt.show()
ax.streamplotの主な引数を説明します。
ax.streamplot(x, y, u, v)
x: ベクトル場のx座標y: ベクトル場のy座標u: ベクトル場のx方向成分v: ベクトル場のy方向成分
x, yは間隔が均等かつ昇順の1次元または2次元の配列となります。
2次元の配列にした場合、x, yは同じ要素数とする必要があります。
1次元の配列にした場合、自動的にnp.meshgrid(x, y)で2次元配列に変換されます。
u, vは2次元配列となり、(2次元配列にした)x, yと同じ要素数にする必要があります。
線の色#
ストリームプロットの線の色を指定する方法を解説します。
ax.streamplotのcolor引数に、数値の2次元配列(uやvと同じ要素数)で色を指定します。
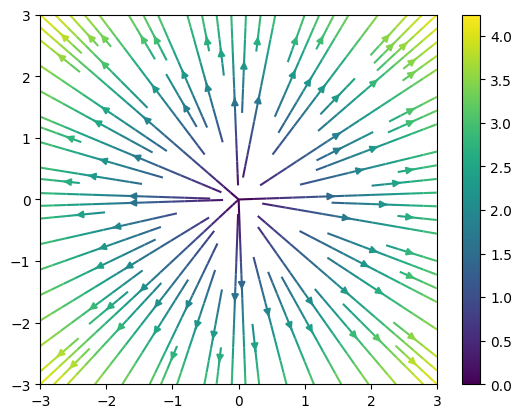
以下の例では、ベクトルの長さvector_lengthをcolor引数に与えています(ベクトルが大きいほど黄色に近い)。
なお、例ではplt.colorbarを使ってカラーバーも表示しています。
ax.streamplotの戻り値はStreamplotSetクラスのインスタンスです。
そのlines属性をplt.colorbarに与えます。
vector_length = np.sqrt(u**2 + v**2)

fig, ax = plt.subplots()
streamplot_set = ax.streamplot(x, y, u, v, color=vector_length)
plt.colorbar(streamplot_set.lines, ax=ax)
plt.show()
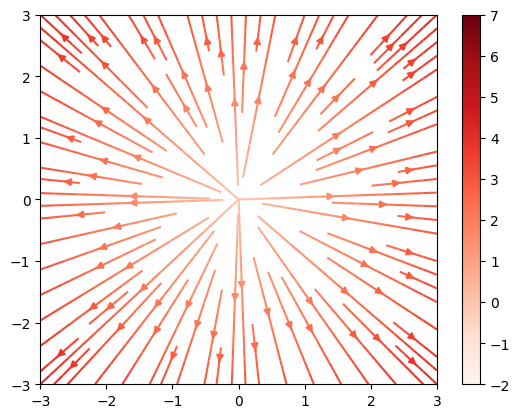
カラーマップは以下のようにax.streamplotのcmap引数で指定できます。
カラーマップの一覧についてはMatplotlibのカラーマップの記事を参照してください。
また、norm引数で色のレンジを指定できます。
matplotlib.colors.Normalizeのvmin, vmaxで最小値と最大値を指定し、norm引数に与えます。
import matplotlib

c_norm = matplotlib.colors.Normalize(vmin=-2, vmax=7)

fig, ax = plt.subplots()
streamplot_set = ax.streamplot(x, y, u, v, color=vector_length, cmap="Reds", norm=c_norm)
plt.colorbar(streamplot_set.lines, ax=ax)
plt.show()
線の密度#
線の密度はax.streamplotのdensity引数で指定できます。
値が大きいほど密度が高くなります(デフォルト値は1)。
fig, ax = plt.subplots()
ax.streamplot(x, y, u, v, density=0.5)
plt.show()
線の表示設定#
ax.streamplotの以下のオプションで線の表示を変更できます。
arrowsize(float): 矢印の大きさ(デフォルト値:1)arrowstyle(str): 矢印のスタイル(デフォルト値:'-|>')broken_streamlines(bool):Trueの場合、ある線が他の線に近づくと途切れます(デフォルト値:True)。
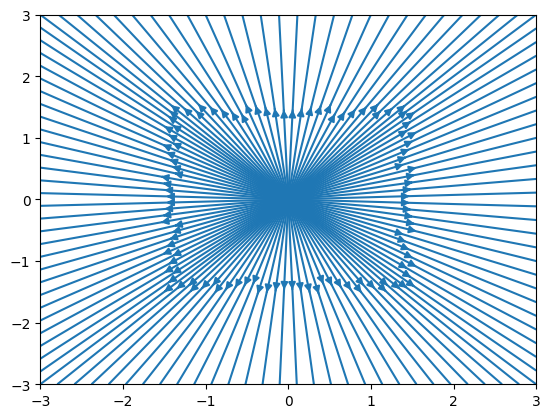
broken_streamlines=Falseとすると、以下のように線が途切れずに描画されます。
fig, ax = plt.subplots()
ax.streamplot(x, y, u, v, broken_streamlines=False)
plt.show()