MatplotlibのFigureオブジェクトの書式#
※記事内に商品プロモーションを含むことがあります。
公開日
この記事では、Figureオブジェクトの書式を設定する方法を解説します。書式の設定では、グラフの大きさや背景色などを変更可能です。
matplotlib.pyplot.subplots()関数を使うと、FigureオブジェクトはAxesオブジェクトと併せて作成されます(matplotlib.pyplot.figure()関数でもFigureオブジェクト単体を作成できます)。
matplotlib.pyplot.subplots()関数のオプションで、Figureオブジェクトの書式を設定します。主なオプションを以下に示します。
オプション |
型 |
説明 |
|---|---|---|
figsize |
(float, float) |
幅と高さ(単位:インチ。デフォルト値: |
facecolor |
color |
背景色(デフォルト値: |
edgecolor |
color |
(デフォルト値: |
linewidth |
float |
枠線の太さ |
frameon |
bool |
|
サイズ#
Figureオブジェクトのサイズを変更するには、subplots()関数のfigsizeオプションで(幅, 高さ)を指定します。
import matplotlib.pyplot as plt
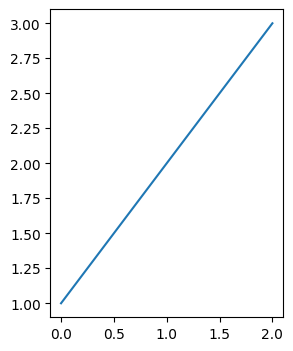
fig, ax = plt.subplots(figsize=(3, 4)) # 幅3インチ、高さ4インチ
ax.plot([1, 2, 3])
plt.show()
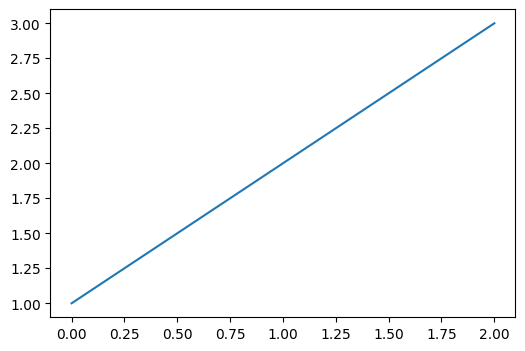
fig, ax = plt.subplots(figsize=(6, 4)) # 幅6インチ、高さ4インチ
ax.plot([1, 2, 3])
plt.show()
背景色・枠線#
Figureオブジェクトの背景色と枠線を変更するには、subplots()関数のfacecolor, edgecolorオプションでそれぞれ指定します。
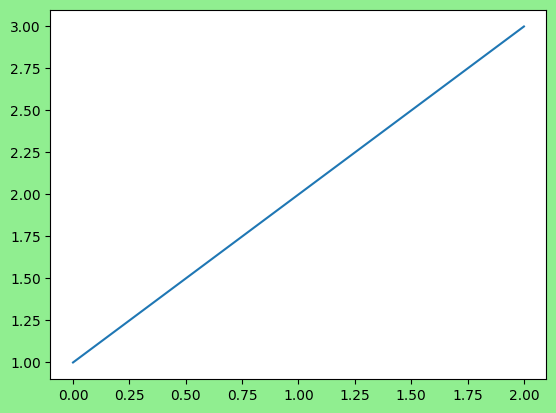
fig, ax = plt.subplots(facecolor='lightgreen')
ax.plot([1, 2, 3])
plt.show()
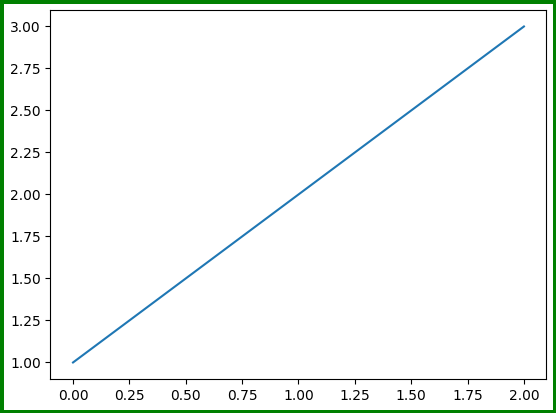
fig, ax = plt.subplots(edgecolor='green', linewidth=5)
ax.plot([1, 2, 3])
plt.show()